Hg19 phyloP histograms: Difference between revisions
From genomewiki
Jump to navigationJump to search
(adding references to histogram data) |
(adding data table statistics) |
||
| Line 1: | Line 1: | ||
Histogram data for phyloP data on the 46-way conservation track on the human genome browser, hg19 | Histogram data for phyloP data on the 46-way conservation track on the human genome browser, hg19<BR> | ||
each of these data tables have 2,845,303,719 data values | |||
[[Image:PhyloP46way.histogram.png|frame|left|phyloP Histogram, all 46 vertebrates]] | <TABLE BORDER=0><TR><TD> | ||
[[Image:PhyloP46way.histogram.png|frame|left|phyloP Histogram, all 46 vertebrates]]</TD></TR><TR><TD> | |||
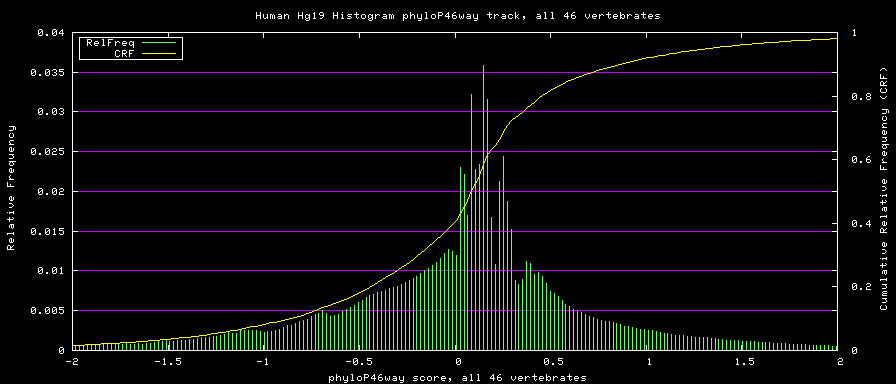
all 46 species data statistics: minimum: -14.08, maximum: 6.424, mean: 0.0896, standard deviation: 0.833186 | |||
</TD></TR><TR><TD> | |||
[[Image:PhyloP46wayPlacental.histogram.png|frame|left|phyloP Histogram, placental mammal subset]] | [[Image:PhyloP46wayPlacental.histogram.png|frame|left|phyloP Histogram, placental mammal subset]]</TD></TR><TR><TD> | ||
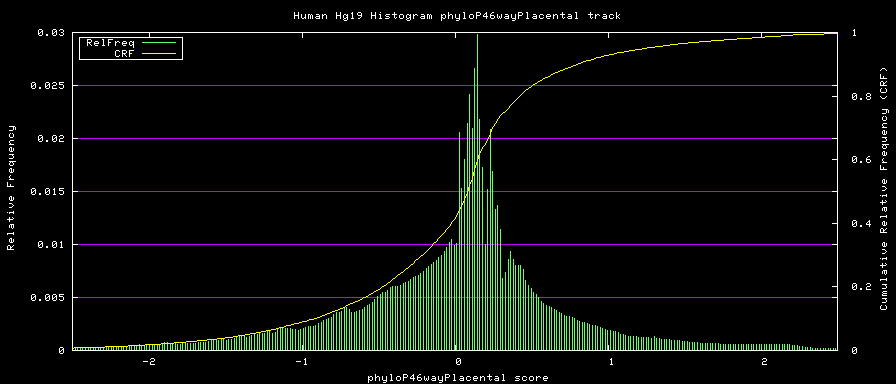
placental mammal subset data statistics: minimum: -13.796, maximum: 2.941, mean: 0.03594, standard deviation: 0.779426 | |||
</TD></TR><TR><TD> | |||
[[Image:PhyloP46wayPrimates.histogram.png|frame|left|phyloP Histogram, primate subset]] | [[Image:PhyloP46wayPrimates.histogram.png|frame|left|phyloP Histogram, primate subset]]</TD></TR><TR><TD> | ||
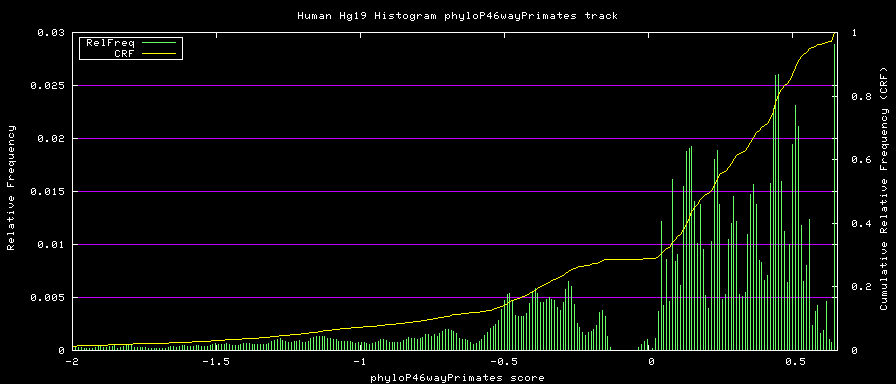
primate subset data statistics: minimum: -9.065, maximum: 0.655, mean: 0.04482, standard deviation: 0.600051 | |||
</TD></TR></TABLE> | |||
[[Category:Technical FAQ]] | [[Category:Technical FAQ]] | ||
[[Category:Comparative Genomics]] | [[Category:Comparative Genomics]] | ||
Latest revision as of 19:47, 1 December 2009
Histogram data for phyloP data on the 46-way conservation track on the human genome browser, hg19
each of these data tables have 2,845,303,719 data values
|
all 46 species data statistics: minimum: -14.08, maximum: 6.424, mean: 0.0896, standard deviation: 0.833186 |
|
placental mammal subset data statistics: minimum: -13.796, maximum: 2.941, mean: 0.03594, standard deviation: 0.779426 |
|
primate subset data statistics: minimum: -9.065, maximum: 0.655, mean: 0.04482, standard deviation: 0.600051 |


